
ArborShadow is a tool which calculates and plots tree shadows onto a plan. It does not offer any kind of appraisal or conclusion to the issue of sunlight in the proposed site. It simply assists the arboriculturist in his/her assessment. It has many limitations and you may indeed consider it to have little value in your own work. You may also not agree with the calculation and plotting method employed.
For these reasons, I recommend you read all of the information pages on this site and try out the demonstration program before considering purchase.
ArborShadow can display a tree shadow for a single moment of time or can show its duration for a whole day as a 'day trace'. They are both shown graphically in 2D. You can imagine that are looking vertically down over the tree and viewing the projected shadow as a shaded area. The screen map/image will always be orientated with its top towards North.
Analyser
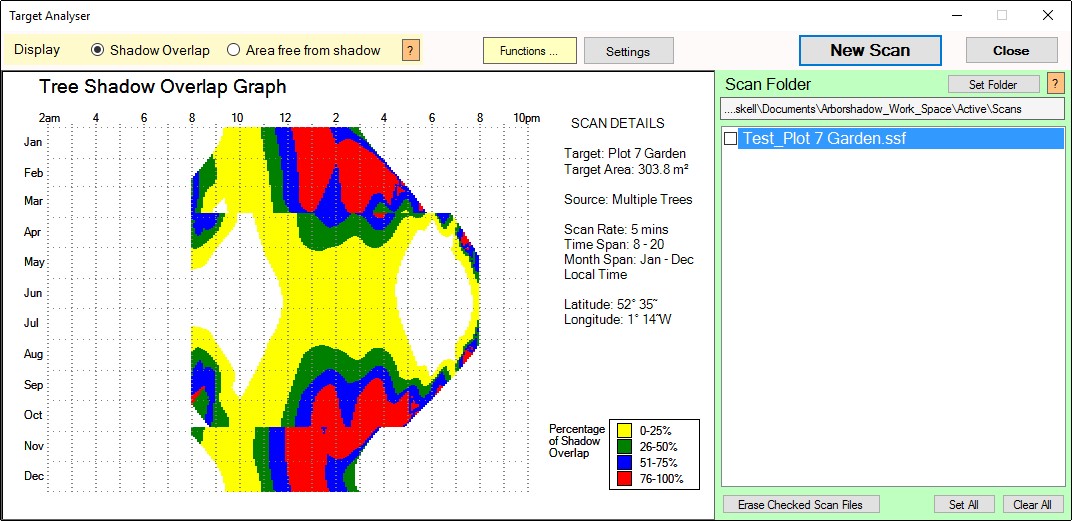
The Analyser window enables a defined reference Area to be scanned for overshadowing by the currently selected tree (or all trees together) for most times of a day and all days of a year. The scanning process produces an interference graph which shows the times of day that shadowing of the target occurred and will show an approximate percentage of interference (i.e. the percentage of the area overlapped by the shadow for that moment in time).
Percentages can be shown on the graph as four ranges of colours (0-25%, 26-50%, 51-75%, 76-100%). This enables the results to be interpreted quickly and a recording made of the image (for use in reports etc).
The following image shows such a scan. The coloured area shows the times (and percentages) when shadowing of the target occurred. I will leave you to work out why the graph shifts one hour to the right for the period ‘end of March to end of October’!
For these reasons, I recommend you read all of the information pages on this site and try out the demonstration program before considering purchase.
ArborShadow can display a tree shadow for a single moment of time or can show its duration for a whole day as a 'day trace'. They are both shown graphically in 2D. You can imagine that are looking vertically down over the tree and viewing the projected shadow as a shaded area. The screen map/image will always be orientated with its top towards North.
Analyser
The Analyser window enables a defined reference Area to be scanned for overshadowing by the currently selected tree (or all trees together) for most times of a day and all days of a year. The scanning process produces an interference graph which shows the times of day that shadowing of the target occurred and will show an approximate percentage of interference (i.e. the percentage of the area overlapped by the shadow for that moment in time).
Percentages can be shown on the graph as four ranges of colours (0-25%, 26-50%, 51-75%, 76-100%). This enables the results to be interpreted quickly and a recording made of the image (for use in reports etc).
The following image shows such a scan. The coloured area shows the times (and percentages) when shadowing of the target occurred. I will leave you to work out why the graph shifts one hour to the right for the period ‘end of March to end of October’!
Animation
ArborShadow has a simple animation feature built into its map display. It can also export the animation as a video sequence (see below).
ArborShadow has a simple animation feature built into its map display. It can also export the animation as a video sequence (see below).
